Description
Signal Dashboard — Laravel Edition: DevOps & Infrastructure Monitoring Admin Template
A DevOps-focused admin dashboard with a terminal-inspired design — cyan accents, dark-first UI, and 14 monitoring pages built for infrastructure teams. Built with Laravel 13, Inertia.js 3, React 19, TypeScript 5, Tailwind CSS v4, and shadcn/ui.
14 Infrastructure & DevOps Pages
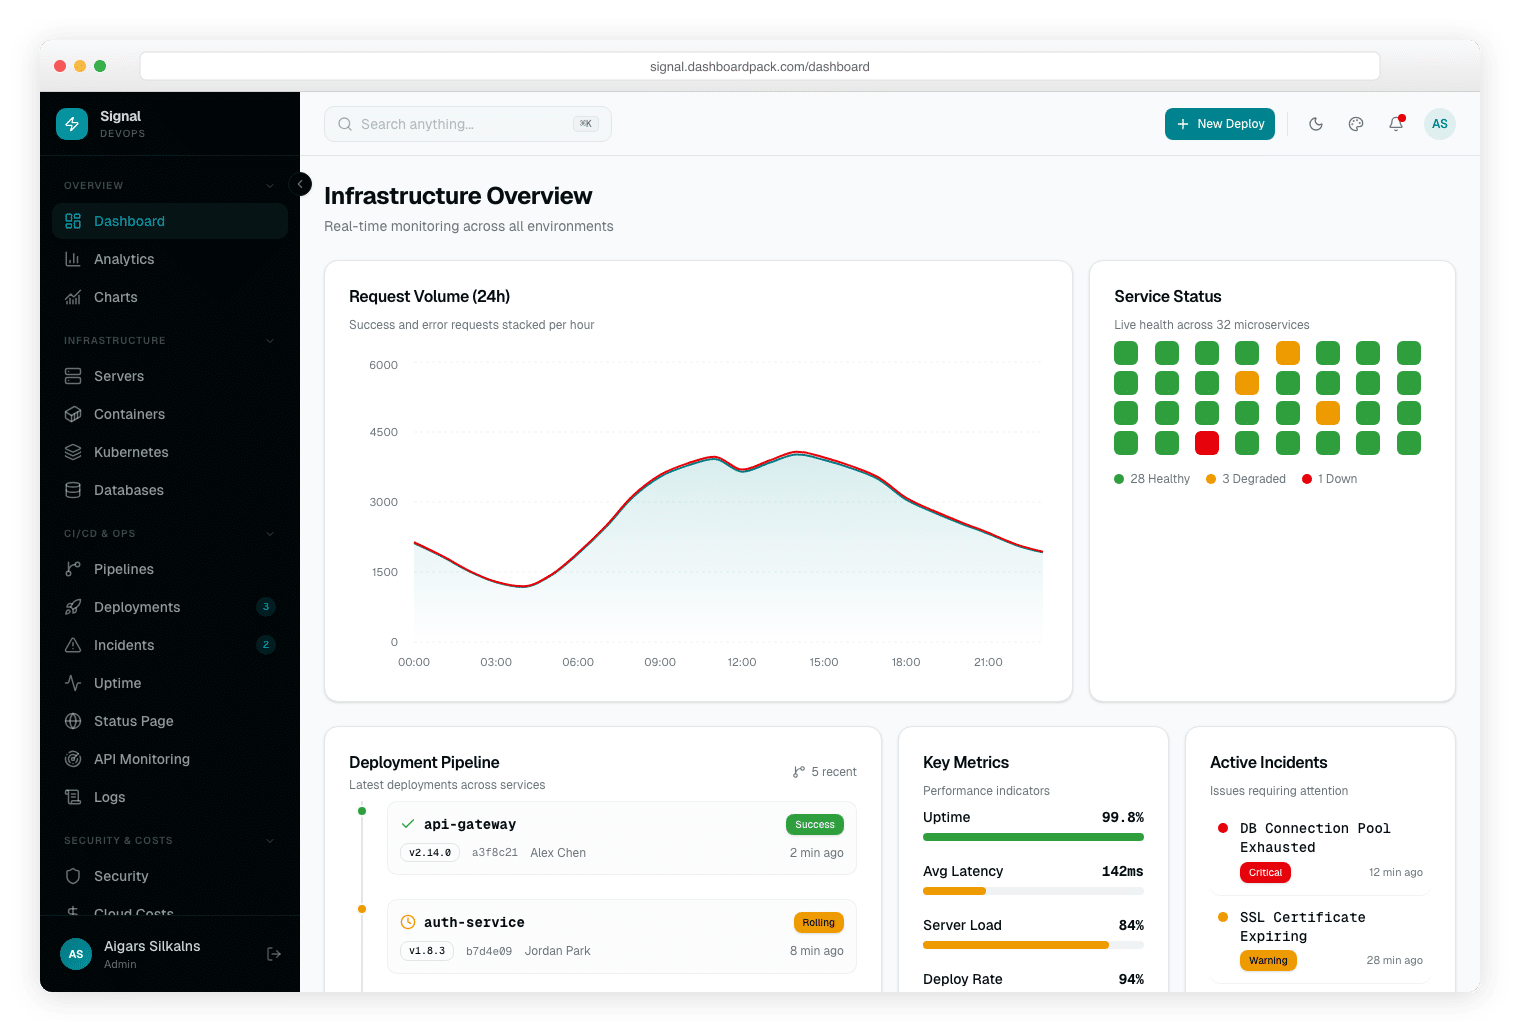
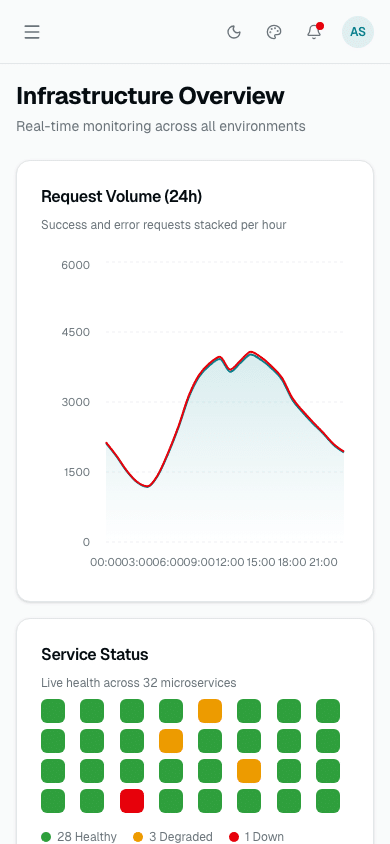
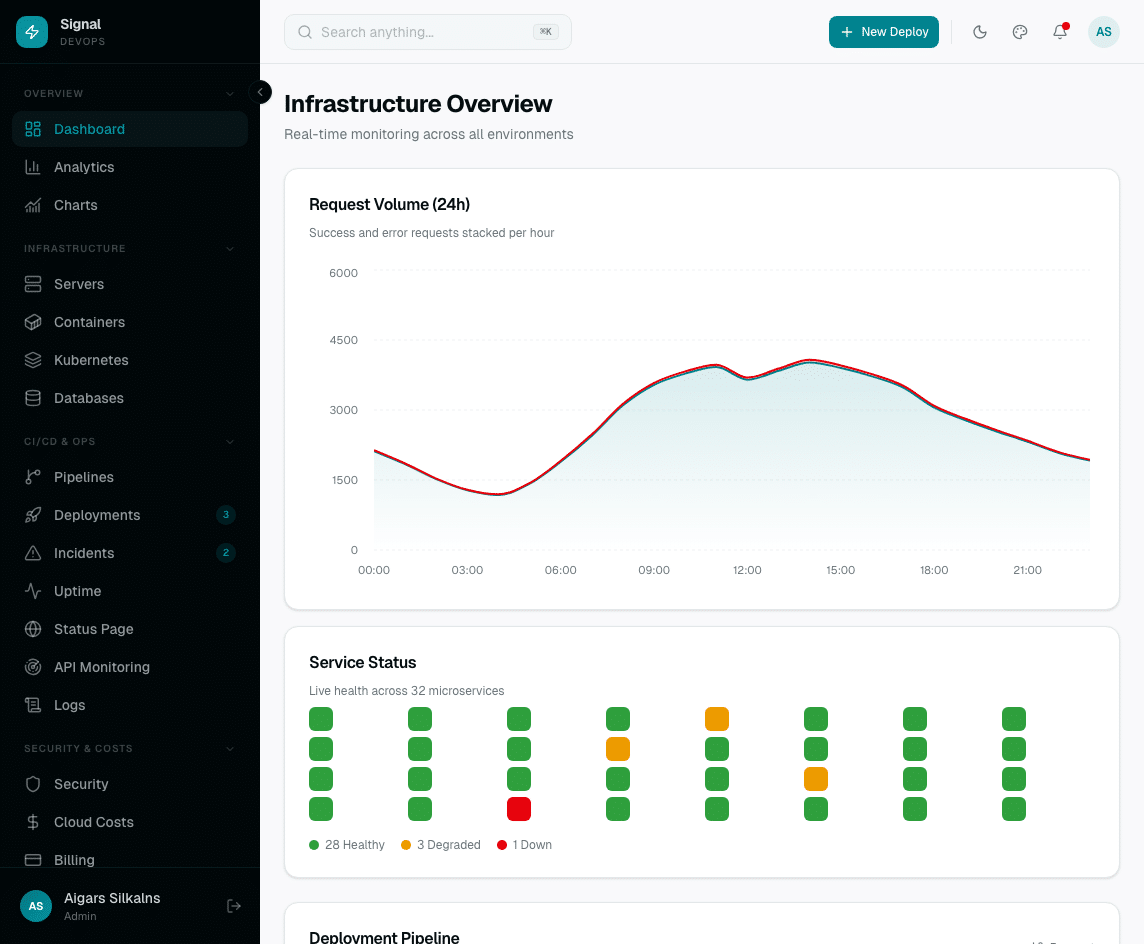
- Infrastructure Overview — Request volume chart, service status grid (32 microservices), deployment pipeline, active incidents, and KPIs
- Server Fleet — Per-server CPU, memory, disk, and uptime with status indicators (Healthy / Degraded / Down)
- Container Management — Docker containers with image, status, CPU/memory, ports, and restart controls
- Kubernetes — Cluster overview: node status, pod health, namespace breakdown, resource utilization
- Database Health — Monitor PostgreSQL, Redis, MongoDB, MySQL: connections, query time, cache hit rate, disk I/O
- CI/CD Pipelines — Pipeline workflows with stage breakdown, run history, success/failure rates, and duration trends
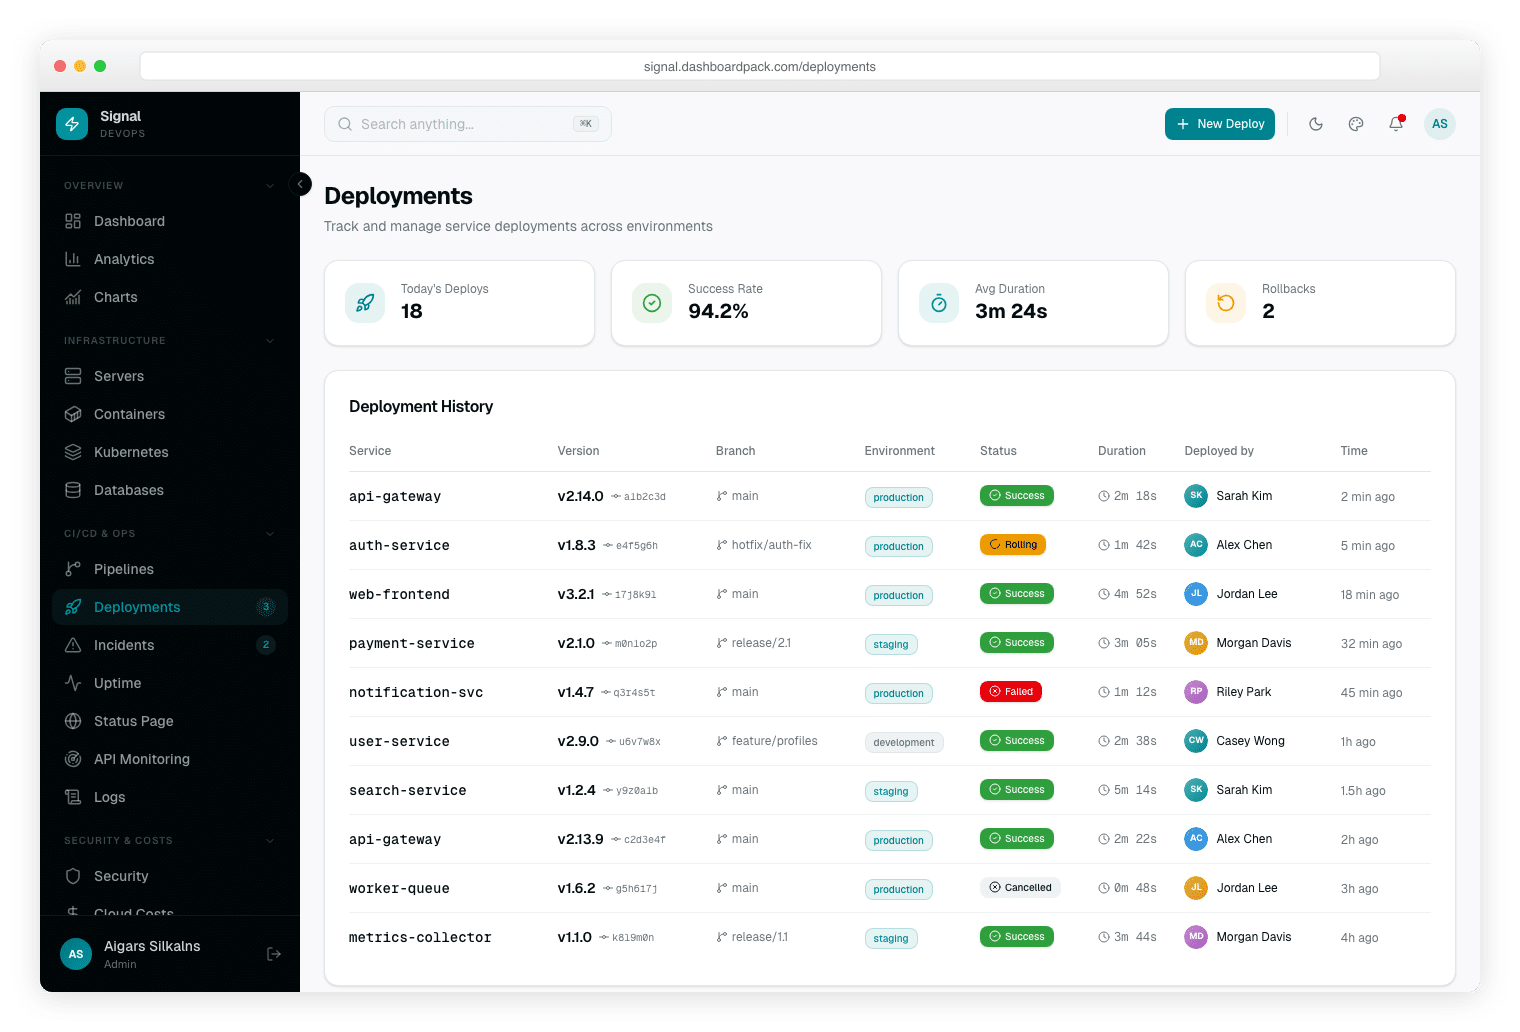
- Deployments — Deployment history across environments (production, staging, dev) with rollback support
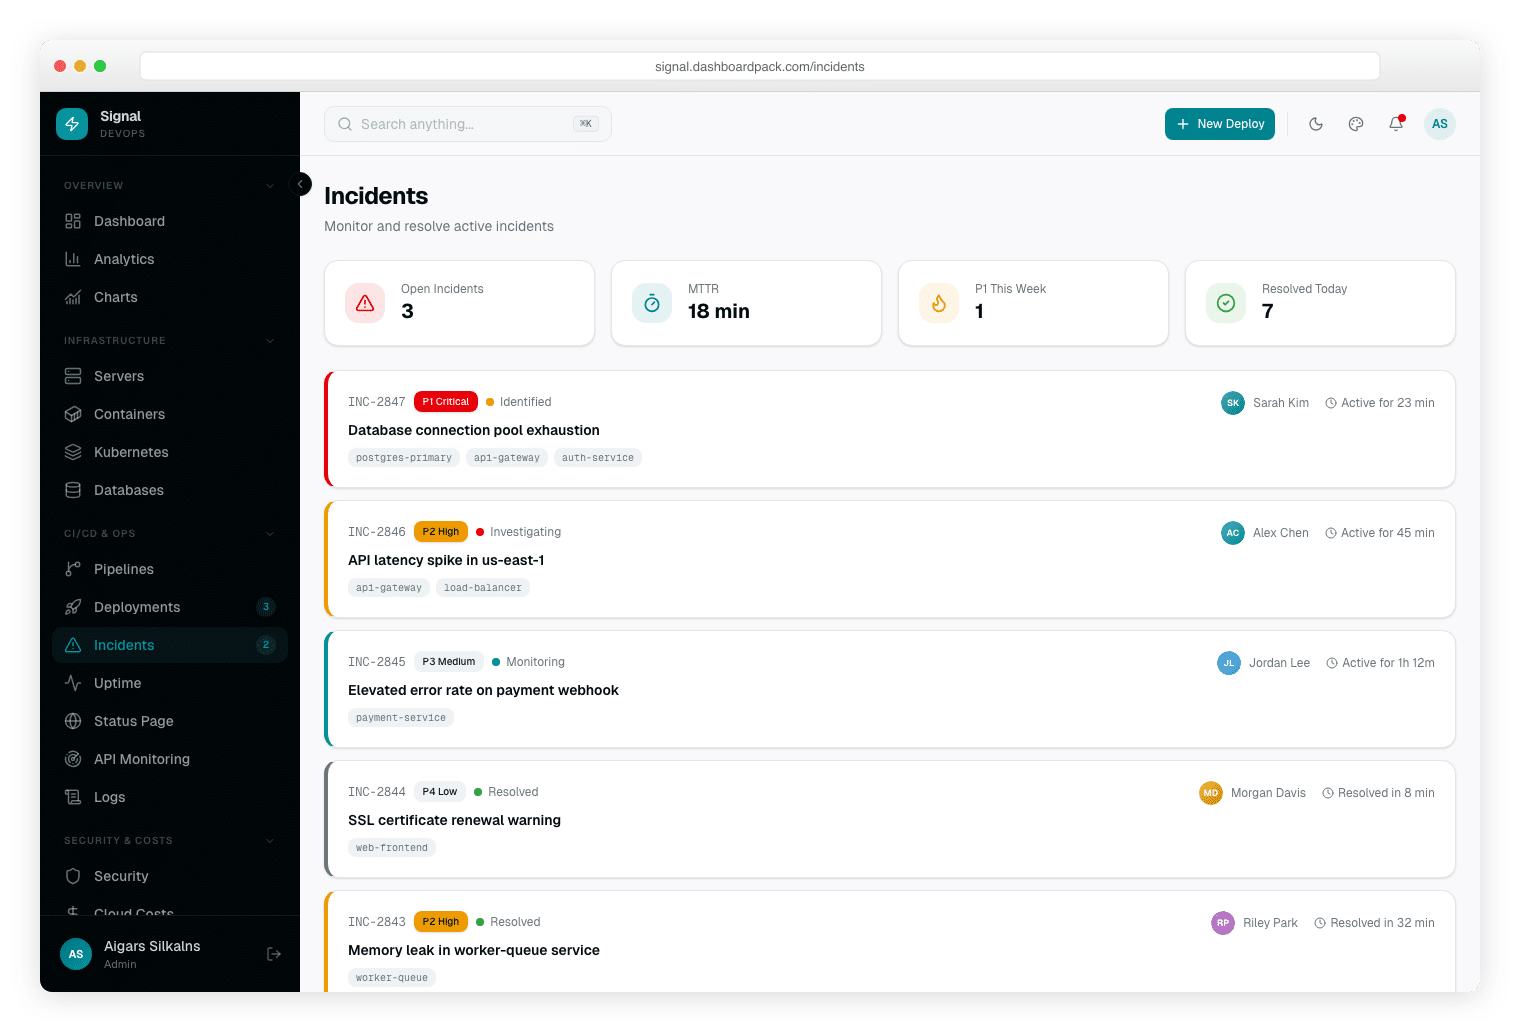
- Incident Management — P1–P4 severity with timeline, assignee, affected services, and resolution tracking
- Uptime Monitoring — 30-day uptime bars per service, SLA percentage, average response time
- Public Status Page — 90-day incident history, current system status, subscriber notification UI
- API Monitoring — Endpoint latency (p50/p95/p99), error rates, throughput, alert thresholds
- Security Audit — CVE findings, vulnerability severity breakdown, open vs resolved issues, compliance score
- Cloud Cost Tracking — Spend by service, cost trends, budget alerts, and optimization recommendations
- Log Explorer — Real-time log stream with level filtering (DEBUG/INFO/WARN/ERROR), search, and time range selection
Analytics & Shared Pages
- Analytics — Traffic and performance charts with time-period filters
- Charts Showcase — 10 chart types (Area, Bar, Line, Pie, Radar, RadialBar, Treemap, Scatter, Composed, Sparkline)
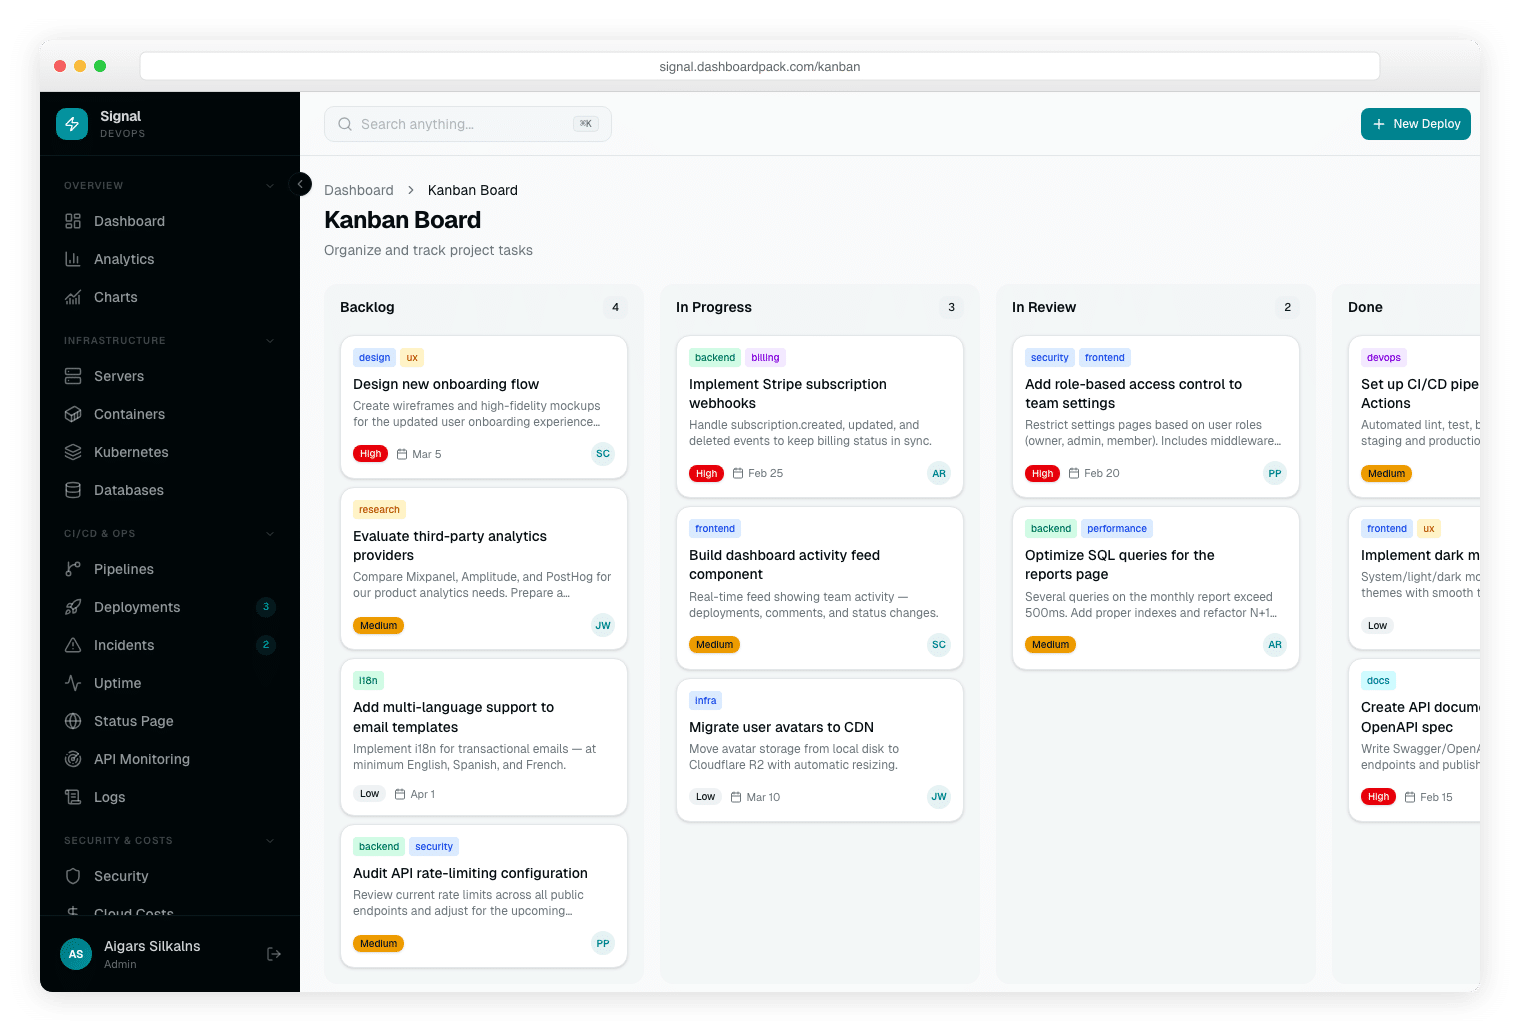
- Kanban Board — Drag-and-drop task management for on-call scheduling and sprint boards
- Calendar — On-call schedule with event creation and editing
- Cloud Billing — Cost breakdown by region, service tier, and team
Real Authentication (Laravel Fortify)
- Sign In, Sign Up with email verification, Forgot Password, Reset Password
- Two-Factor Authentication (TOTP), Confirm Password gate
- Spatie RBAC — Admin, Editor, Viewer roles with granular permissions
Terminal-Inspired Design
- Cyan accent — Primary color OKLCh hue 200 (cyan), evoking network traffic and terminal prompts
- Dark-first UI — Designed dark-first; light mode available for office environments
- 6 Color Presets — Default/Cyan, Ocean, Sunset, Forest, Berry, Slate
- 3 Density Levels — Compact, Default, Comfortable
- RTL Toggle — Full right-to-left layout support
- Layout Options — Sidebar or horizontal top-nav; fluid or boxed container
Developer Experience
- 34 shadcn/ui Components — Vendored, accessible, Radix UI primitives
- Inline Demo Data — All DevOps pages use realistic hardcoded mock data — no external APIs needed
- TanStack Table v8 — Sorting, filtering, pagination on all data tables
- Type-Safe Forms — React Hook Form + Zod
- Internationalization — English, German, French with type-safe keys
- Pest Tests — Feature tests for auth and authorization
- Demo Mode — DEMO_MODE=true for read-only public previews
- Built-in /docs Site — Getting started, theming, and deployment guides
- Driver-Aware Queries — SQLite (default), MySQL 8+, MariaDB 10.10+, PostgreSQL 14+, and Microsoft SQL Server 2012+
Tech Stack
| Category | Technology |
|---|---|
| Backend | Laravel 13, Eloquent ORM |
| Auth | Laravel Fortify (2FA, email verification) |
| Permissions | Spatie laravel-permission |
| Bridge | Inertia.js 3 |
| UI Library | React 19 with React Compiler |
| Language | TypeScript 5 (strict mode) |
| Styling | Tailwind CSS v4, OKLCh cyan tokens |
| Components | shadcn/ui (34 vendored primitives) |
| Charts | Recharts 3 (10 chart types) |
| Data Tables | TanStack Table v8 |
| Forms | React Hook Form + Zod |
| Database | SQLite, MySQL, MariaDB, PostgreSQL, Microsoft SQL Server (portable Eloquent throughout) |
| Testing | Pest (PHP feature tests) |
License: Commercial | View Live Demo → | Documentation →